Et reelt grønt skifte handler om bærekraftig forandring i mer klima- og miljøvennlig retning, og innenfor naturens tålegrenser. FN mener at tap av natur er en like stor trussel mot menneskeheten som klimaendringene, og FNs bærekraftsmål nr. 7 er tydelig på at alle skal sikres tilgang til pålitelig, bærekraftig og moderne energi til en overkommelig pris. Dette innebærer betydelige utfordringer når energiforbruket i verden skal elektrifiseres.
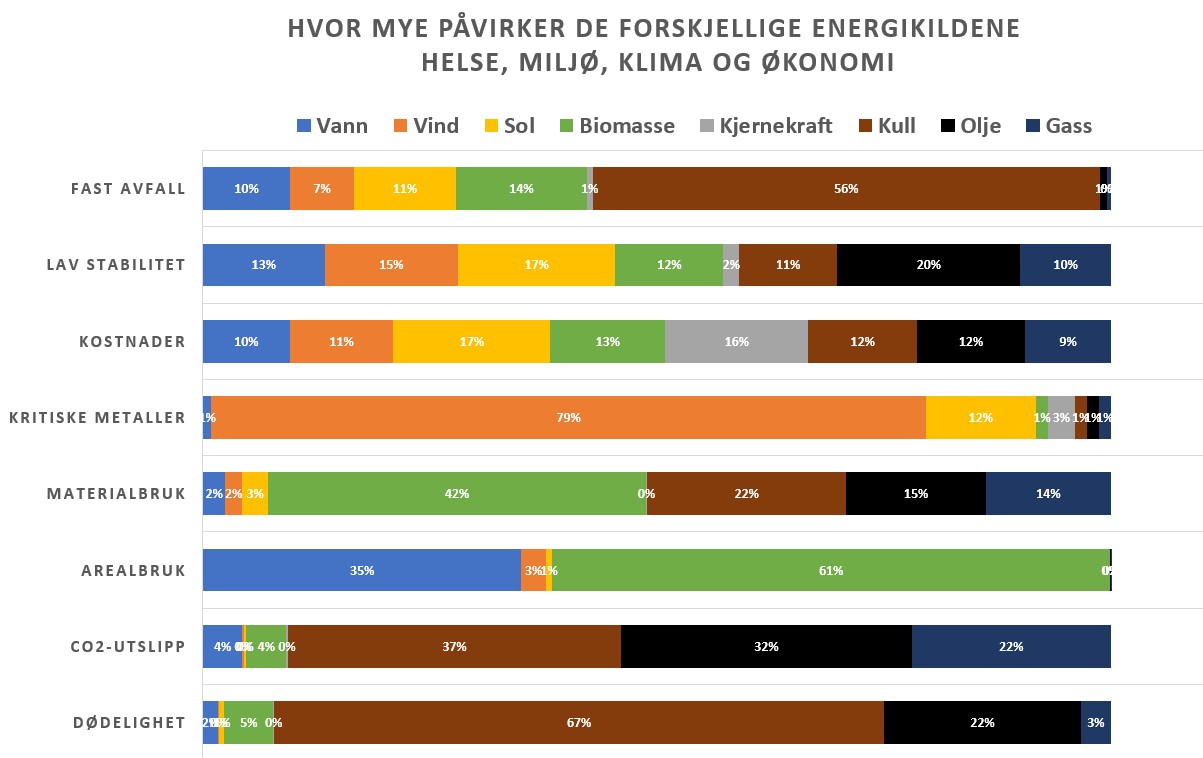
En diskusjon om framtidens energimiks krever forståelse for hvilken total påvirkning hver enkelt energikilde har på helse, miljø, klima og økonomi. Hver enkelt av oss vil ha ulik oppfatning av hvilke parametere som betyr mest (for eksempel utslipp av klimagasser) og vi har derfor laget denne siden for at du kan selv vekte de forskjellige faktorene og se hva utfallet blir.
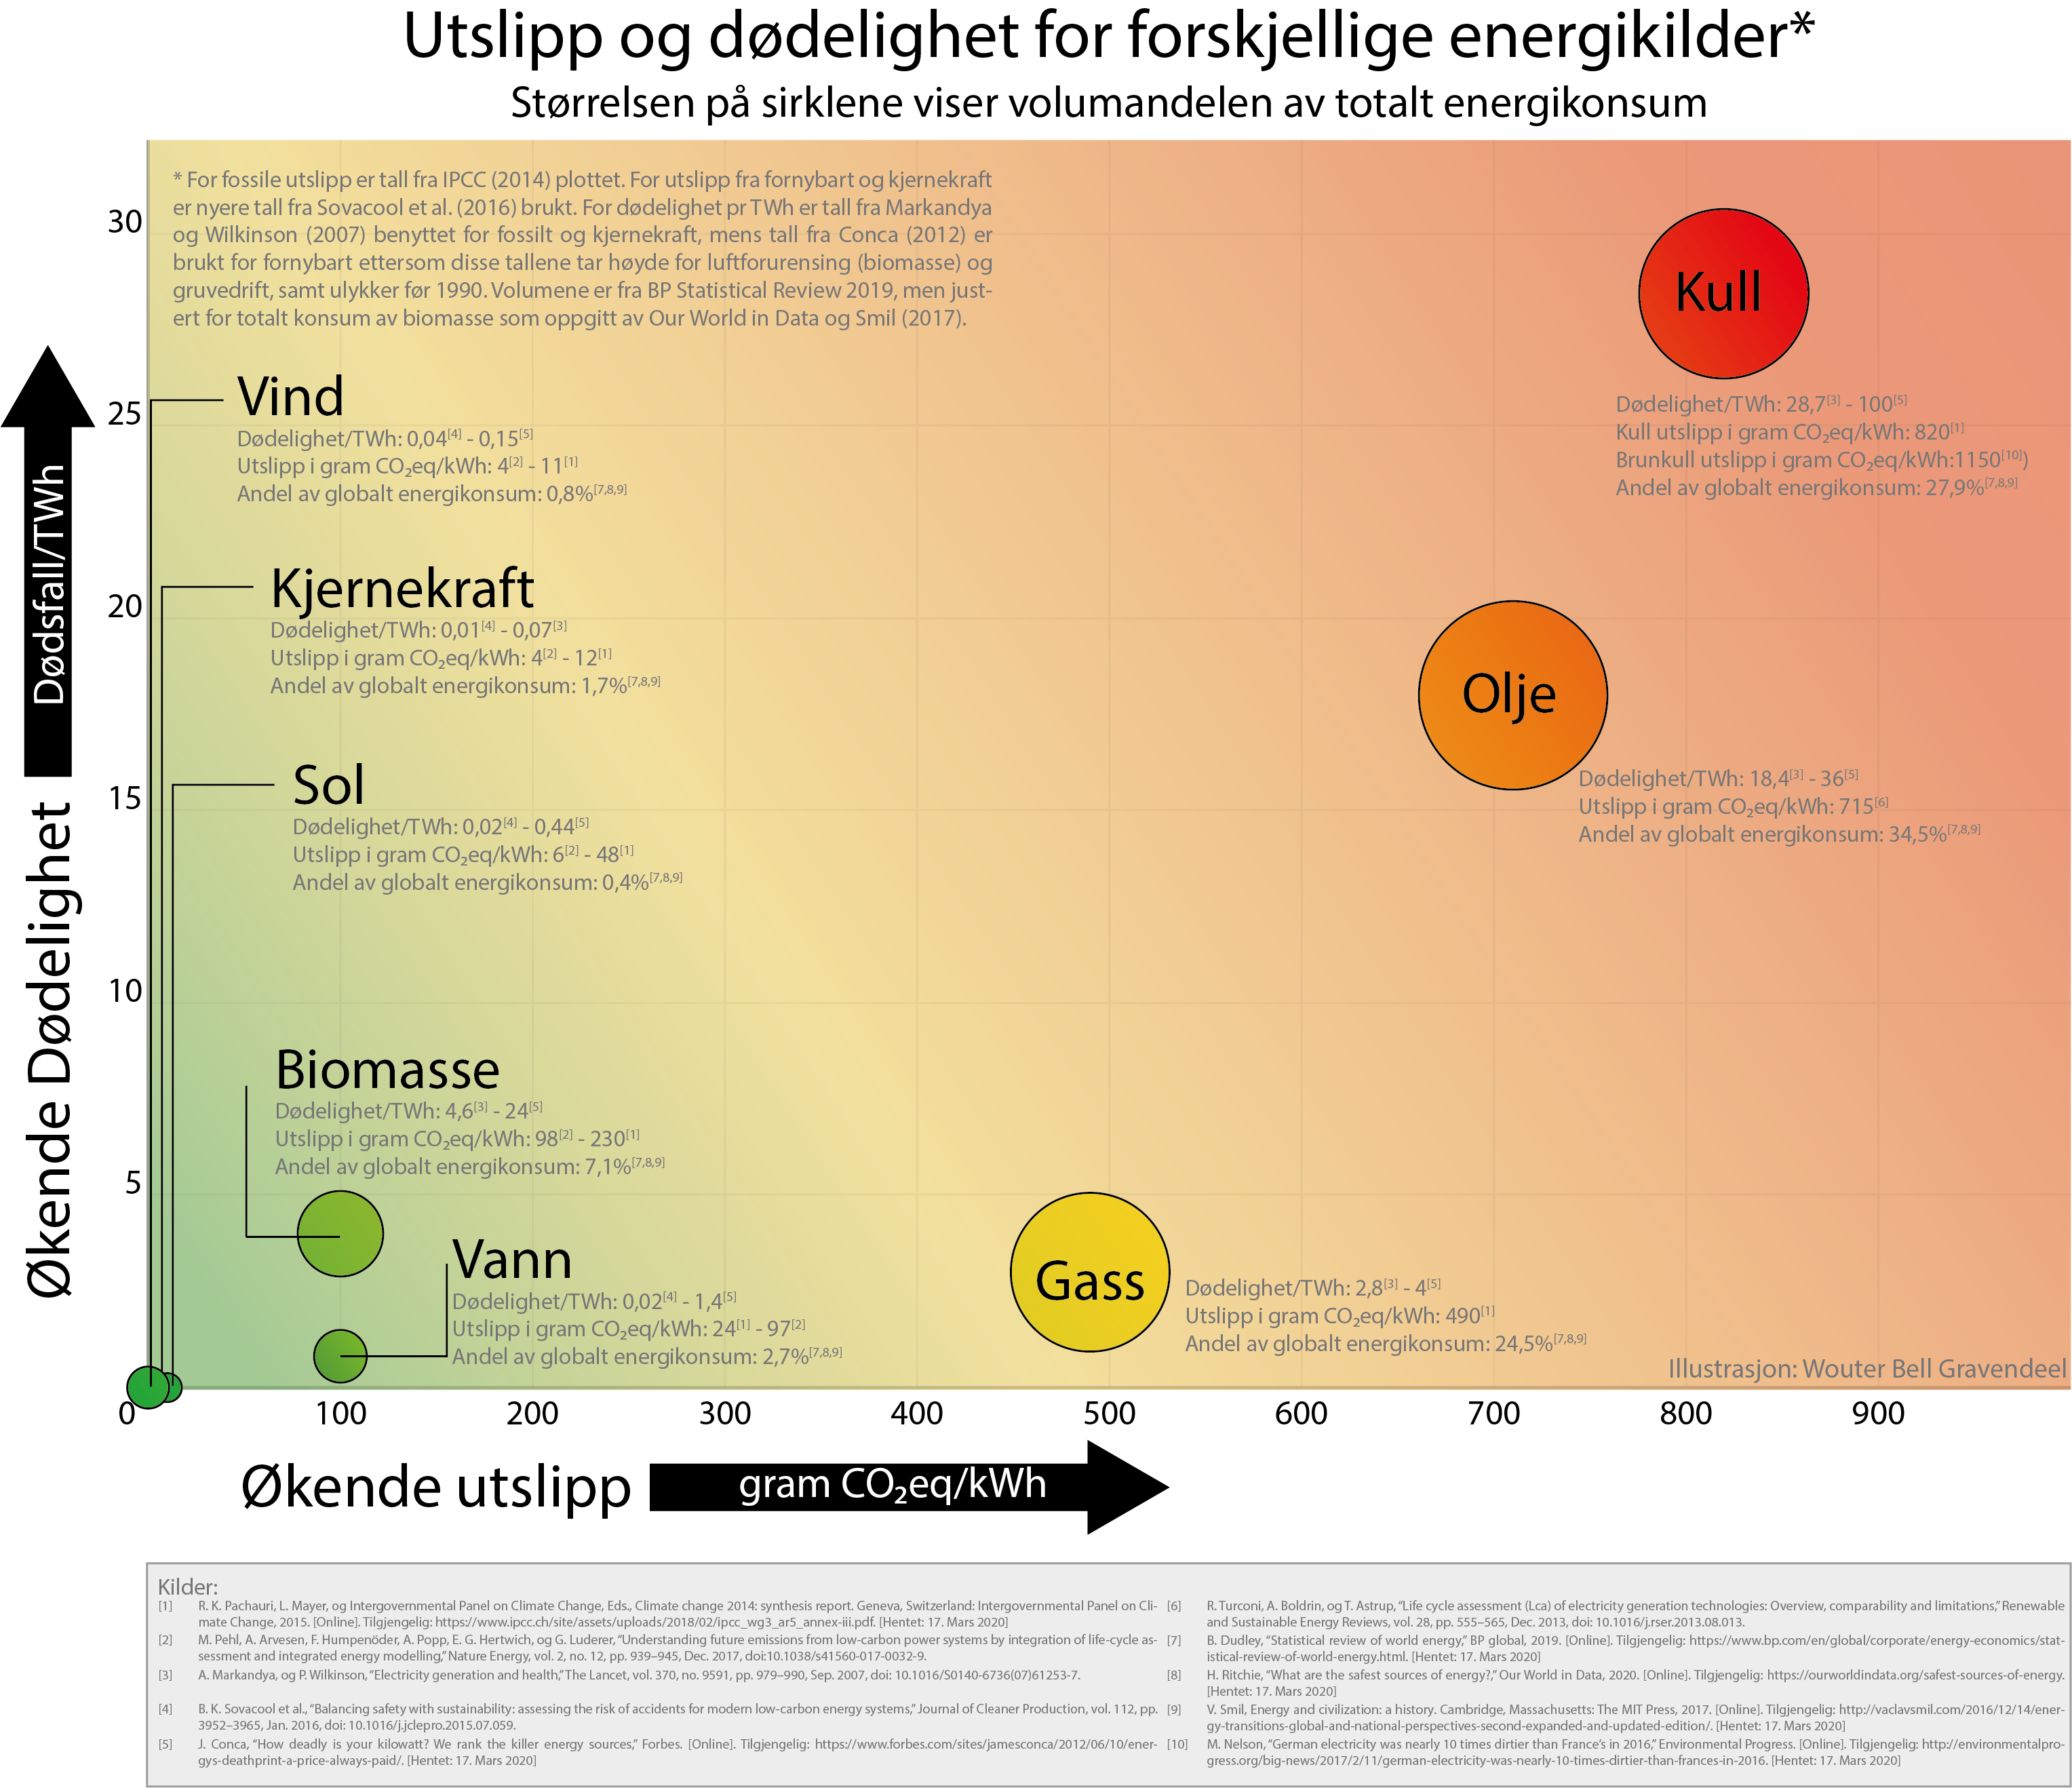
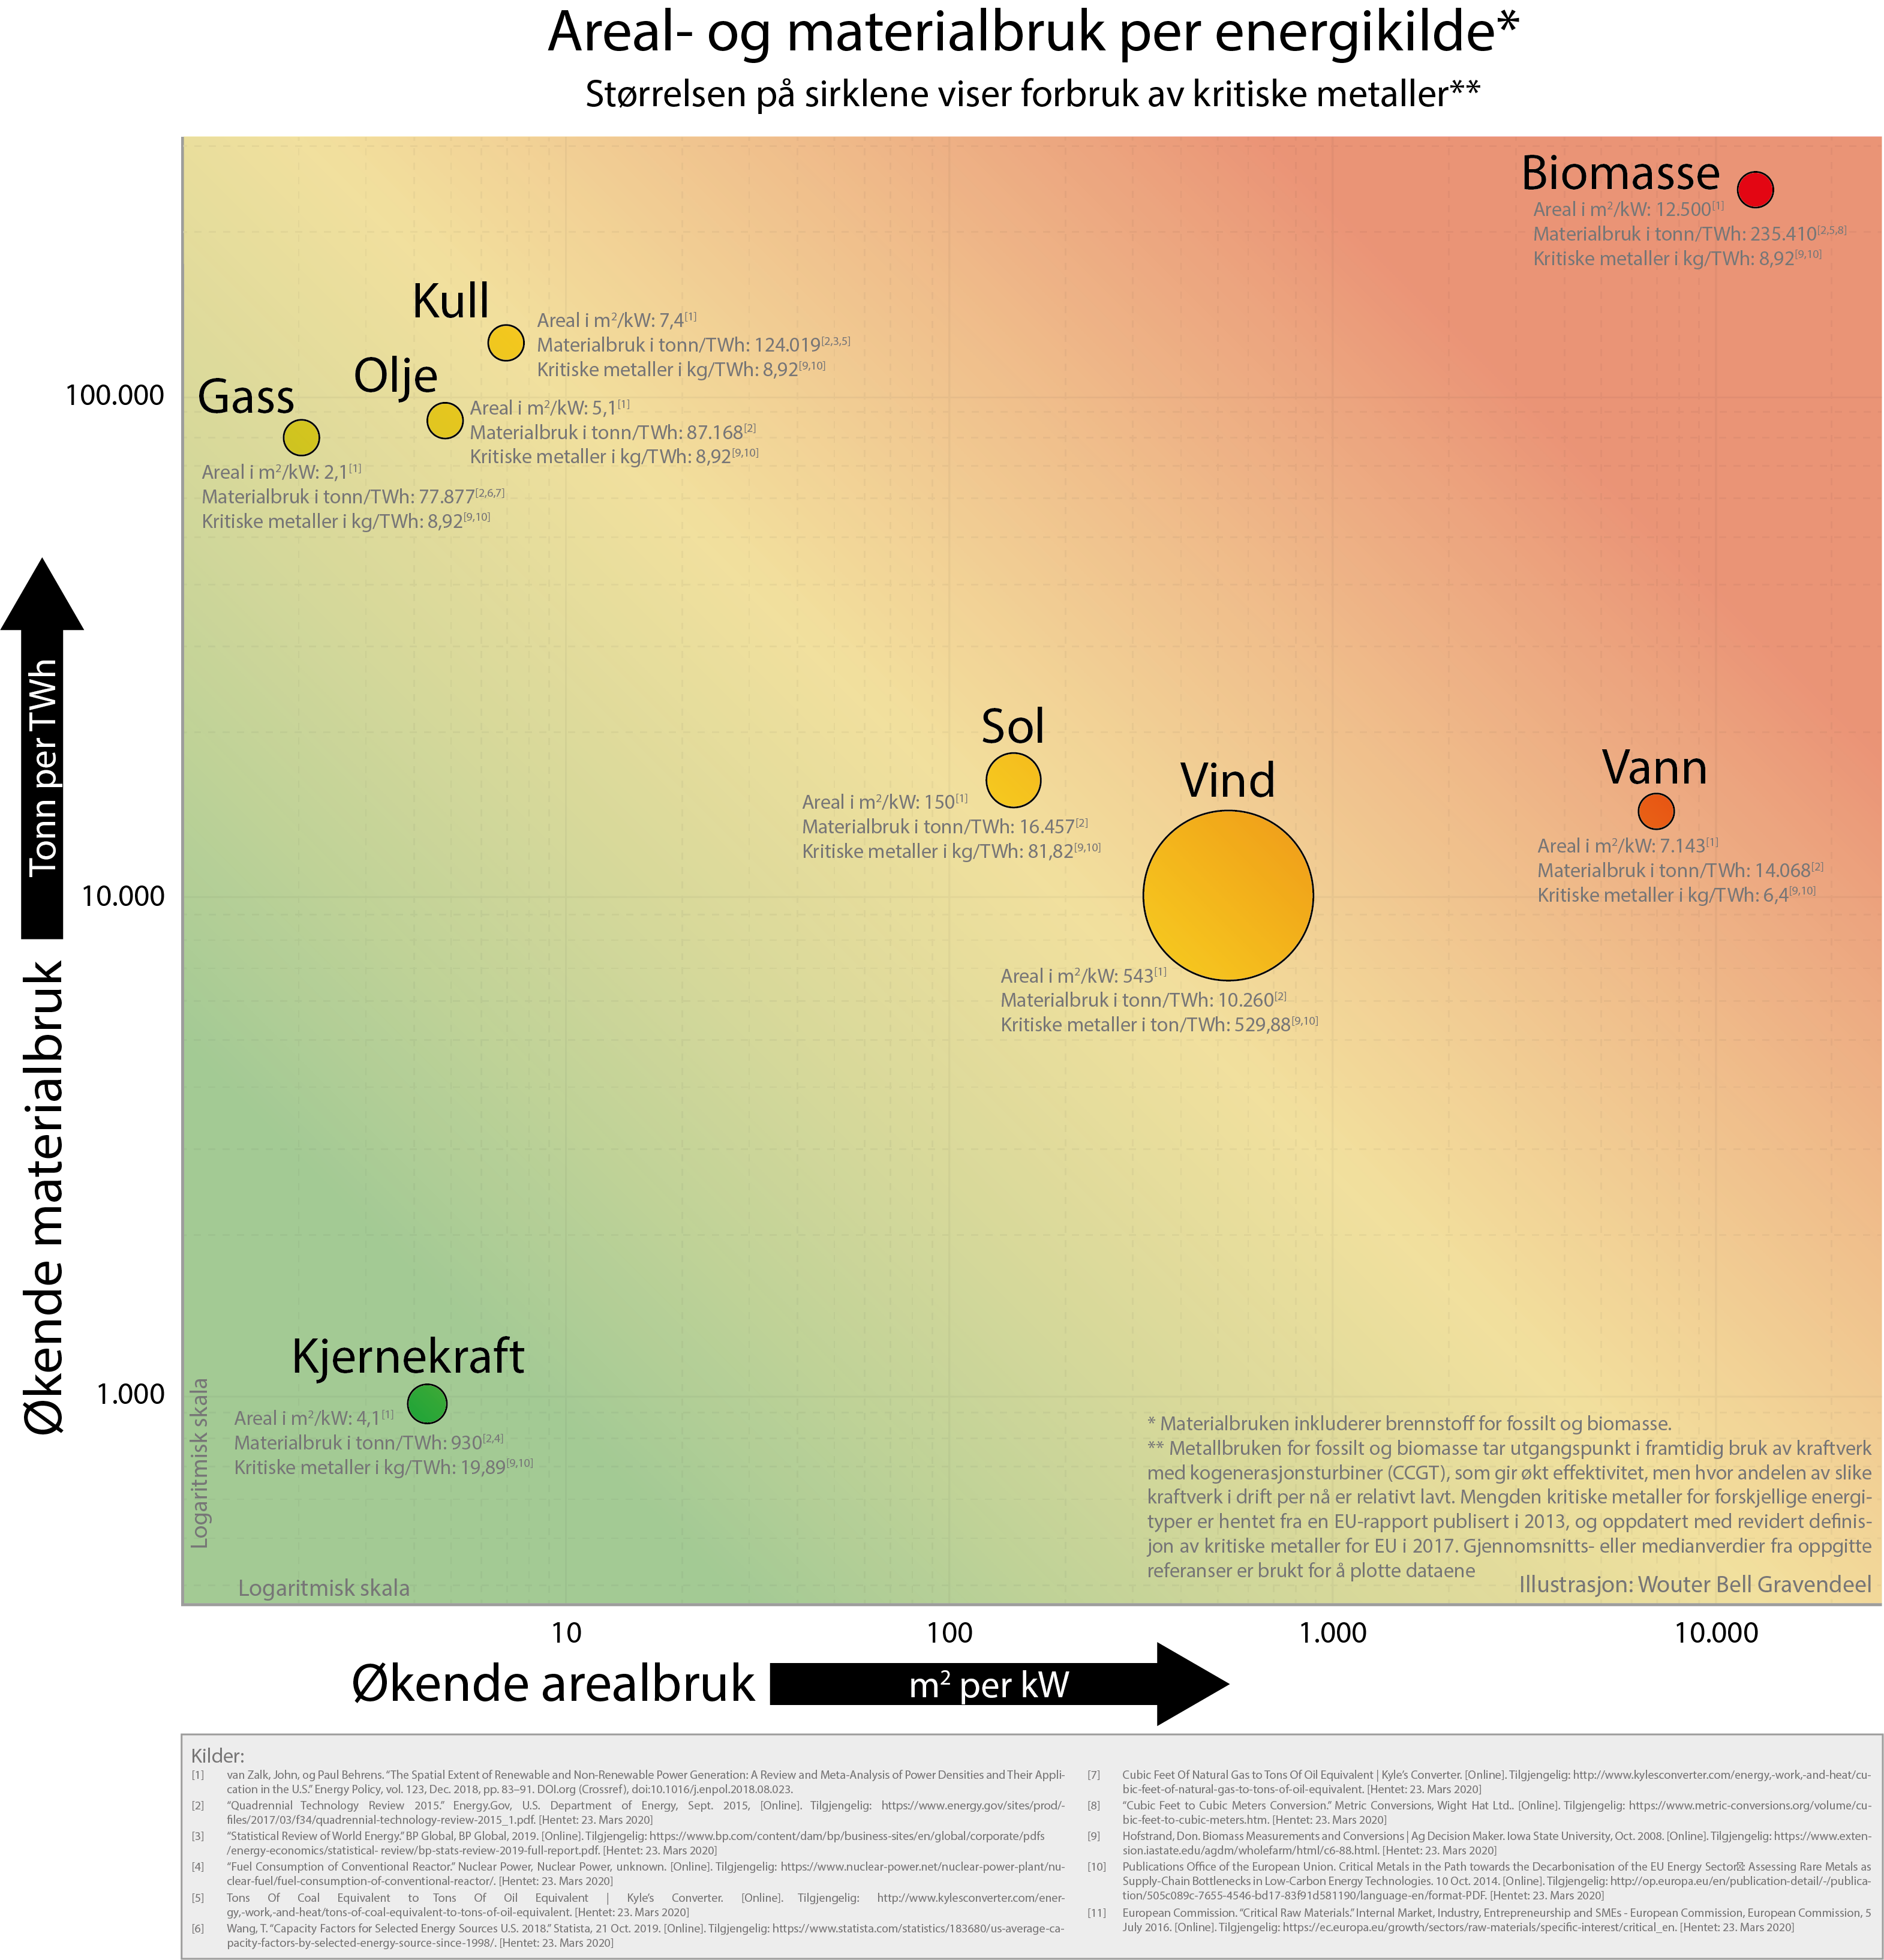
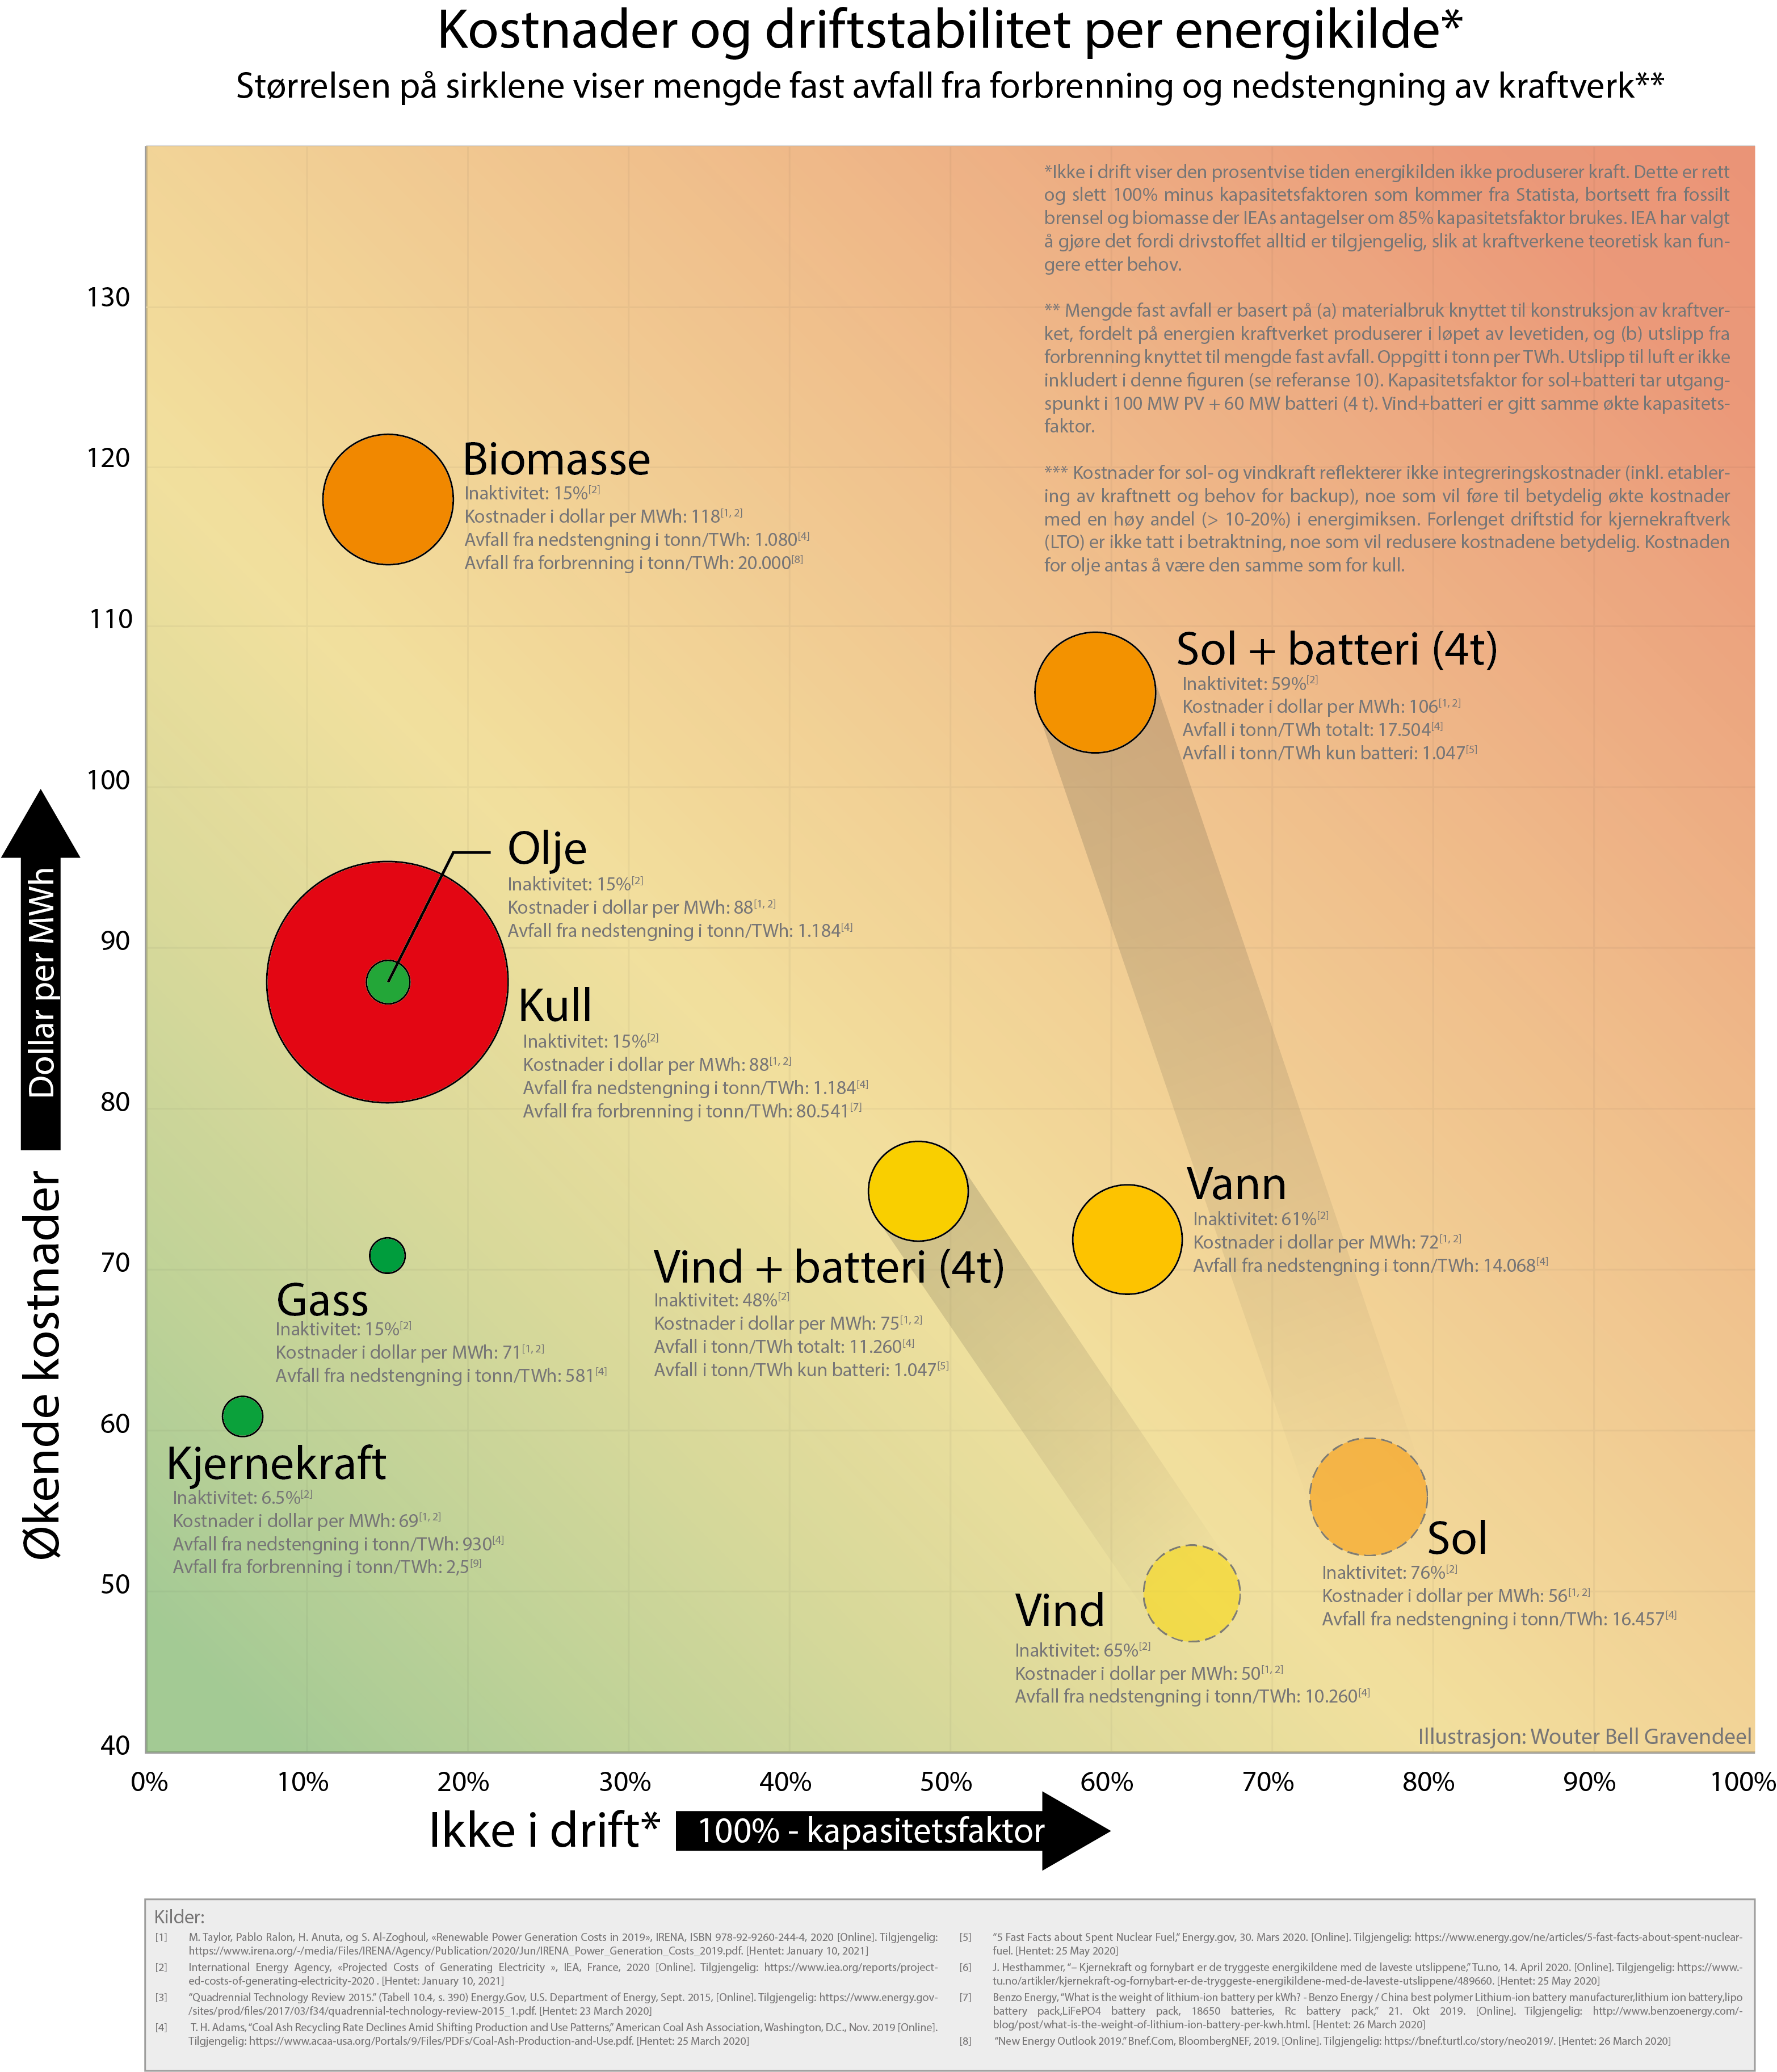
Åtte forskjellige parametere er tatt med i analysen. Disse er dødelighet, utslipp, arealbruk, materialbruk, kritiske metaller, kostnader, stabilitet og avfall. Underlaget finner du ved å klikke på «Lær mer om…»-linkene. Alle vil ikke nødvendigvis være enig i de valgene vi har tatt, men vi har forsøkt å være så objektiv som mulig og finne de mest robuste kildene. Så får vi heller endre det dersom det blir nødvendig. Vi håper at dette kan bidra positivt i debatten om fremtidens energimiks.
I tabellen under søylediagrammet kan du velge hvor viktig hver parameter er for deg (som utgangspunkt er parameterne likt vektet). Søylediagrammet oppdateres basert på dine valg. Hver parameter summerer til 100%, og totalen vises langs y-aksen.
Dette er tallene vi har brukt for å regne ut fotavtrykket til energikildene. I noen tilfeller oppgir kildene intervaller. Da har vi benyttet median- eller gjennomsnittsverdier som kildene oppgir.
OPPDATERING 10.1.21: Kostnader for fornybart er oppdatert med 2020 tall fra IEA [35] (for fornybart tar IEA utgangspunkt i tall utarbeidet av IRENA [36], men kan avvike fra disse grunnet forskjellige utregninger). Merk at disse tallene antar en karbonavgift på 30 USD/tonn CO2. I stedet for å bruke "Lav stabilitet", har vi bestemt oss for å bruke begrepet "Ikke i drift" for bedre å gjenspeile at den prosentvise tiden kraftverkene ikke er i drift på grunn av aspekter som fravær av vind og sol, samt andre årsaker.
Dette er rett og slett 100% minus kapasitetsfaktoren. Kapasitetsfaktoren er oppdatert med faktiske 2019-tall fra Statista [34], med unntak av fossilt brensel og biomasse der vi har brukt IEAs 2020-antagelser om 85% kapasitetsfaktor.
IEA har valgt å gjøre det fordi brenselet alltid er tilgjengelig, slik at kraftstasjonene i teorien kan være i drift ved behov.
Kostnader for sol- og vindkraft reflekterer ikke integreringskostnader (bl.a. etablering av strømnett og behov for backup), noe som vil medføre vesentlig økte kostnader ved høy andel (>10-20%) i energimiksen.
Det er ikke tatt høyde for langtidsoperasjon av kjernekraft (LTO), noe som vil redusere kostnadene vesentlig. Ved 20 års forlengelse av eksisterende kjernekraftverk, vil denne energitypen være den billigste i følge IEA.
Kilder:
Data til dette prosjektet er innhentet av Jonny Hesthammer og Wouter Bell Gravendeel.
Arealbruk
[1] Van Zalk, John, og Paul Behrens.
“The Spatial Extent of Renewable and Non-Renewable Power Generation: A Review and Meta-Analysis of Power Densities and Their Application in the U.S.” Energy Policy, vol. 123, Dec. 2018, pages. 85–88. DOI.org (Crossref), doi:10.1016/j.enpol.2018.08.023.
Kostnader
[2] Renewable Energy Costs in 2018. IRENA, 2019. [Online]. Available:
https://www.irena.org/-/media/Files/IRENA/Agency/Publication/2019/May/IRENA_Renewable-Power-Generations-Costs-in-2018.pdf. [Accessed: 24. March 2020]
[3] Stacy, Thomas F., og George S. Taylor. The Levelized Cost of Electricity from Existing Generation Resources. Institute for Energy Research, June 2019. [Online]. Available:
https://www.instituteforenergyresearch.org/wp-content/uploads/2019/06/IER_LCOE2019Final-.pdf. [Accessed: 24. March 2020]
[4] “New Energy Outlook 2019.” Bnef.Com, BloombergNEF, 2019. [Online]. Available:
https://bnef.turtl.co/story/neo2019/. [Accessed: 26. March 2020]
[35] International Energy Agency, «Projected Costs of Generating Electricity », IEA, France, 2020 [Online]. Available:
https://www.iea.org/reports/projected-costs-of-generating-electricity-2020. [Accessed: January 10, 2021]
[36] M. Taylor, Pablo Ralon, H. Anuta, og S. Al-Zoghoul, «Renewable Power Generation Costs in 2019», IRENA, ISBN 978-92-9260-244-4, 2020 [Online]. Available:
https://www.irena.org/-/media/Files/IRENA/Agency/Publication/2020/Jun/IRENA_Power_Generation_Costs_2019.pdf. [Accessed: January 10, 2021]
Utslipp
[5] R. Turconi, A. Boldrin, og T. Astrup,
“Life cycle assessment (Lca) of electricity generation technologies: Overview, comparability and limitations,” Renewable and Sustainable Energy Reviews, vol. 28, pp. 555–565, Dec. 2013, doi: 10.1016/j.rser.2013.08.013.
[6] M. Pehl, A. Arvesen, F. Humpenöder, A. Popp, E. G. Hertwich, og G. Luderer,
“Understanding future emissions from low-carbon power systems by integration of life-cycle assessment and integrated energy modelling,” Nature Energy, vol. 2, no. 12, pp. 939–945, Dec. 2017, doi:10.1038/s41560-017-0032-9.
Supplementary tables download link:
https://static-content.springer.com/esm/art%3A10.1038%2Fs41560-017-0032-9/MediaObjects/41560_2017_32_MOESM2_ESM.xls
[7] R. K. Pachauri, L. Mayer, og Intergovernmental Panel on Climate Change, Eds., Climate change 2014: synthesis report. Geneva, Switzerland: Intergovernmental Panel on Climate Change, 2015. [Online]. Available:
https://www.ipcc.ch/site/assets/uploads/2018/02/ipcc_wg3_ar5_annex-iii.pdf. [Accessed: 17. March 2020]
Dødelighet
[8] A. Markandya, og P. Wilkinson,
“Electricity generation and health,” The Lancet, vol. 370, no. 9591, pp. 979–990, Sep. 2007, doi: 10.1016/S0140-6736(07)61253-7.
[9] B. K. Sovacool et al.,
“Balancing safety with sustainability: assessing the risk of accidents for modern low-carbon energy systems,” Journal of Cleaner Production, vol. 112, pp. 3952–3965, Jan. 2016, doi: 10.1016/j.jclepro.2015.07.059.
[10] H. Ritchie, “What are the safest sources of energy?,” Our World in Data, 2020. [Online]. Available:
https://ourworldindata.org/safest-sources-of-energy. [Accessed: 17. March 2020]
[11] J. Conca, “How deadly is your kilowatt? We rank the killer energy sources,” Forbes. [Online]. Available:
https://www.forbes.com/sites/jamesconca/2012/06/10/energys-deathprint-a-price-always-paid/. [Accessed: 17. March 2020]
Materialbruk
[12] “Quadrennial Technology Review 2015.” Energy.Gov, U.S. Department of Energy, Sept. 2015, [Online]. Available:
https://www.energy.gov/sites/prod/files/2017/03/f34/quadrennial-technology-review-2015_1.pdf. [Accessed: 23. March 2020]
[13] “Fuel Consumption of Conventional Reactor.” Nuclear Power, Nuclear Power, unknown. [Online]. Available:
https://www.nuclear-power.net/nuclear-power-plant/nuclear-fuel/fuel-consumption-of-conventional-reactor/. [Accessed: 23. March 2020]
[14] Wang, T. “Capacity Factors for Selected Energy Sources U.S. 2018.” Statista, 21 Oct. 2019. [Online]. Available:
https://www.statista.com/statistics/183680/us-average-capacity-factors-by-selected-energy-source-since-1998/ [Accessed: 23. March 2020]
[15] Benzo Energy, “What is the weight of lithium-ion battery per kWh? - Benzo Energy / China best polymer Lithium-ion battery manufacturer,lithium ion battery,lipo battery pack,LiFePO4 battery pack, 18650 batteries, Rc battery pack,” 21-Oct-2019. [Online]. Available:
http://www.benzoenergy.com/blog/post/what-is-the-weight-of-lithium-ion-battery-per-kwh.html. [Accessed: 26. March 2020]
Kritiske metaller
[16] Publications Office of the European Union. Critical Metals in the Path towards the Decarbonisation of the EU Energy Sector: Assessing Rare Metals as Supply-Chain Bottlenecks in Low-Carbon Energy Technologies. 10 Oct. 2014. [Online]. Available:
http://op.europa.eu/en/publication-detail/-/publication/505c089c-7655-4546-bd17-83f91d581190/language-en/format-PDF. [Accessed: 23. March 2020]
[17] European Commission. “Critical Raw Materials.” Internal Market, Industry, Entrepreneurship and SMEs - European Commission, European Commission, 5 July 2016. [Online]. Available:
https://ec.europa.eu/growth/sectors/raw-materials/specific-interest/critical_en. [Accessed: 23. March 2020]
Avfall
[12] “Quadrennial Technology Review 2015.” Energy.Gov, U.S. Department of Energy, Sept. 2015, [Online]. Available:
https://www.energy.gov/sites/prod/files/2017/03/f34/quadrennial-technology-review-2015_1.pdf. [Accessed: 23. March 2020]
[18] “5 Fast Facts about Spent Nuclear Fuel,” Energy.gov, 30-Mar-2020. [Online]. Available:
https://www.energy.gov/ne/articles/5-fast-facts-about-spent-nuclear-fuel [Accessed: 25-May-2020]
[19] F. Lamers, M. Cremers, D. Matschegg, and C. Schmidl, “Options for increased use of ash from biomass combustion and co-firing,” 2018 [Online]. Available:
https://www.ieabioenergy.com/wp-content/uploads/2019/02/IEA-Bioenergy-Ash-management-report-revision-5-november.pdf [Accessed: 25-May-2020]
[20] T. H. Adams, “Coal Ash Recycling Rate Declines Amid Shifting Production and Use Patterns,” American Coal Ash Association, Washington, D.C., Nov. 2019 [Online]. Available:
https://www.acaa-usa.org/Portals/9/Files/PDFs/Coal-Ash-Production-and-Use.pdf [Accessed: 25-May-2020]
[15] Benzo Energy, “What is the weight of lithium-ion battery per kWh? - Benzo Energy / China best polymer Lithium-ion battery manufacturer,lithium ion battery,lipo battery pack,LiFePO4 battery pack, 18650 batteries, Rc battery pack,” 21-Oct-2019. [Online]. Available:
http://www.benzoenergy.com/blog/post/what-is-the-weight-of-lithium-ion-battery-per-kwh.html. [Accessed: 26. March 2020]
Stabilitet
[21] Wang, T. “Capacity Factors for Selected Energy Sources U.S. 2018.” Statista, 21 Oct. 2019. [Online]. Available:
https://www.statista.com/statistics/183680/us-average-capacity-factors-by-selected-energy-source-since-1998/ [Accessed: 23. March 2020]
[34] N. Sönnichsen, “Capacity factors for selected energy sources U.S. 2019”, Statista, July 27, 2020. [Online]. Available:
https://www.statista.com/statistics/183680/us-average-capacity-factors-by-selected-energy-source-since-1998/. [Accessed: January 10, 2021]
[35] International Energy Agency, «Projected Costs of Generating Electricity », IEA, France, 2020 [Online]. Available:
https://www.iea.org/reports/projected-costs-of-generating-electricity-2020 . [Accessed: January 10, 2021]
Dagens energiforbruk per energikilde
[22] B. Dudley, “Statistical review of world energy,” BP global, 2019. [Online]. Available:
https://www.bp.com/en/global/corporate/energy-economics/statistical-review-of-world-energy.html. [Accessed: 17. March 2020]
[23] V. Smil, Energy and civilization: a history. Cambridge, Massachusetts: The MIT Press, 2017. [Online]. Available:
http://vaclavsmil.com/2016/12/14/energy-transitions-global-and-national-perspectives-second-expanded-and-updated-edition/. [Accessed: 17. March 2020]
[10] H. Ritchie, “What are the safest sources of energy?,” Our World in Data, 2020. [Online]. Available:
https://ourworldindata.org/safest-sources-of-energy. [Accessed: 17. March 2020]
CCS
[24] B. Metz, O. Davidson, M. Leo, L. Manuela, and H. de Coninck, “Carbon Dioxide Capture and Storage,” Intergovernmental Panel on Climate Change, New York, 2005 [Online]. Available:
https://www.ipcc.ch/site/assets/uploads/2018/03/srccs_wholereport-1.pdf [Accessed: June 22, 2020]
[25] S. Budinis, S. Krevor, N. M. Dowell, N. Brandon, and A. Hawkes,
“An assessment of CCS costs, barriers and potential,” Energy Strategy Reviews, vol. 22, pp. 68, table 6, Nov. 2018, doi: 10.1016/j.esr.2018.08.003.
Energimiks 2050 (IPCC medianverdier)
[26] J. Rogelj, D. Shindell, and K. Jiang, “Mitigation Pathways Compatible with 1.5°C in the Context of Sustainable Development,” IPCC, 2019, page 132-133 [Online]. Available:
https://www.ipcc.ch/site/assets/uploads/sites/2/2019/02/SR15_Chapter2_Low_Res.pdf [Accessed: May 6, 2020]
Energiforbruk og arealbehov per person
[27] D. Mackay, Sustainable Energy - Without the hot air. Cambridge: UIT, 2009 [Online]. Available:
https://www.withouthotair.com/[Accessed: June 22, 2020]
[28] “Energy use (kg of oil equivalent per capita) | Data.” [Online]. Available:
https://data.worldbank.org/indicator/EG.USE.PCAP.KG.OE?view=map[Accessed: June 22, 2020]
[29] “List of countries and dependencies by area,” Wikipedia. 10-Jun-2020 [Online]. Available:
https://en.wikipedia.org/w/index.php?title=List_of_countries_and_dependencies_by_area&oldid=961823799[Accessed: June 22, 2020]
[1] Van Zalk, John, og Paul Behrens.
“The Spatial Extent of Renewable and Non-Renewable Power Generation: A Review and Meta-Analysis of Power Densities and Their Application in the U.S.” Energy Policy, vol. 123, Dec. 2018, pages. 85–88. DOI.org (Crossref), doi:10.1016/j.enpol.2018.08.023.
Konvertering
[30] Tons Of Coal Equivalent to Tons Of Oil Equivalent | Kyle’s Converter. [Online]. Available:
http://www.kylesconverter.com/energy,-work,-and-heat/tons-of-coal-equivalent-to-tons-of-oil-equivalent. [Accessed: 23. March 2020]
[31] Cubic Feet Of Natural Gas to Tons Of Oil Equivalent | Kyle’s Converter. [Online]. Available:
http://www.kylesconverter.com/energy,-work,-and-heat/cubic-feet-of-natural-gas-to-tons-of-oil-equivalent. [Accessed: 23. March 2020]
[32]“Cubic Feet to Cubic Meters Conversion.” Metric Conversions, Wight Hat Ltd.. [Online]. Available:
https://www.metric-conversions.org/volume/cubic-feet-to-cubic-meters.htm. [Accessed: 23. March 2020]
[33] Hofstrand, Don. Biomass Measurements and Conversions | Ag Decision Maker. Iowa State University, Oct. 2008. [Online]. Available:
https://www.extension.iastate.edu/agdm/wholefarm/html/c6-88.html. [Accessed: 23. March 2020]